"Python + Finance" - Indian Stock Market data analysis
Day 1 - I think I can find it, let me try..
Day 2 - I must try hard now, I can..
Day 3 - Uff.. Why am I not able to get that..
Day 7 - I am going to spend a whole day.. will find for sure..
.
.
.
Day 45 - Nah, Looks like its not available let me find some alternate way..
.
.
.
Day 'n' - Whoooh... Yes I did it.. this is how the journey was when I try to get a working API for Indian Stock Market Data. (Unfortunately, Google Finance stopped its API support long back)
Though my search for this API is for a different purpose, found an alternate way to achieve my goal (more on this later in a separate blog post). Right now I'm interested in give you all an overview on what and all can be achieved from this NSE (National Stock Exchange) module.
So before explaining about the NSE module, I have used Jupyter Notebooks here since it helps me to easily plot the graph with desired data set so that I can edit and see the changes on the go.
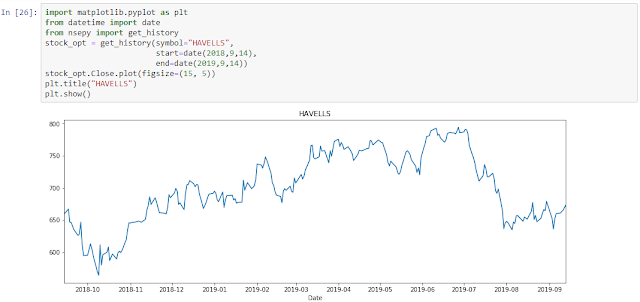
From the above image, we could see I have used nsepy module to get the historical data for "HAVELLS" scrip and later used pyplot method from matplotlib module to plot the graph of "HAVELLS" scrip using its historical closing price for the last one year.
Also the support is not just limited to regular stock price changes, we have even support for derivatives such as Options and Futures.
The above documentation clearly explains about the list of arguments present and its expected values, so with this details I have plotted the Options and Futures graph for "ITC" scrip
Similarly for "ITC" Futures Graph is as follows,
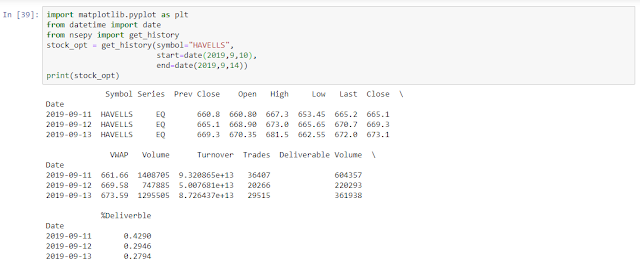
Covering below are the other important scrip data we get,
Day 2 - I must try hard now, I can..
Day 3 - Uff.. Why am I not able to get that..
Day 7 - I am going to spend a whole day.. will find for sure..
.
.
.
Day 45 - Nah, Looks like its not available let me find some alternate way..
.
.
.
Day 'n' - Whoooh... Yes I did it.. this is how the journey was when I try to get a working API for Indian Stock Market Data. (Unfortunately, Google Finance stopped its API support long back)
Though my search for this API is for a different purpose, found an alternate way to achieve my goal (more on this later in a separate blog post). Right now I'm interested in give you all an overview on what and all can be achieved from this NSE (National Stock Exchange) module.
So before explaining about the NSE module, I have used Jupyter Notebooks here since it helps me to easily plot the graph with desired data set so that I can edit and see the changes on the go.
 |
| HAVELLS INDIA - One Year Price Graph |
From the above image, we could see I have used nsepy module to get the historical data for "HAVELLS" scrip and later used pyplot method from matplotlib module to plot the graph of "HAVELLS" scrip using its historical closing price for the last one year.
Also the support is not just limited to regular stock price changes, we have even support for derivatives such as Options and Futures.
 |
| get_history details |
The above documentation clearly explains about the list of arguments present and its expected values, so with this details I have plotted the Options and Futures graph for "ITC" scrip
 |
| ITC - Options Graph |
Similarly for "ITC" Futures Graph is as follows,
 |
| ITC - Futures Graph |
Covering below are the other important scrip data we get,
- Previous Closing Price
- Open Price
- High
- Low
- Last
- Close Price
- VWAP(Volume Weighted Average Price)
- Volume
- Turnover
- Trades
- Deliverable Volume
- Delivery % etc
 |
| Scrip data |
As I write this post, I'm very much excited so I might have missed to address some of your queries, please feel free to post your doubts on comment section. I will get it addressed as soon as I can.
Also I will explore more on this module and keep you all posted with all my new findings. Fingers Crossed
Source Code:
Please click on the below git hub link for the source code explained using python,


Good work!!
ReplyDeleteCan you pass multiple share names and other params as an array in the single request?
Thanks Himanshu. Right now the "symbol" argument can take only one share name at a time. For multiple share results we can create an array of share names and can iterate through each as shown below,
Deleteimport matplotlib.pyplot as plt
from datetime import date
from nsepy import get_history
symbols = ["HAVELLS","ITC"]
for symbol in symbols:
stock_opt = get_history(symbol=symbol,
start=date(2019,9,10),
end=date(2019,9,14))
print(stock_opt)
Good Information.....Keep sharing. Do you have any plans to advance or promote the stock?
ReplyDeletebirlasunlife insurance
everest kanto share price
exide battery share price
ipca laboratories
rbl bank
hul
chola mandalam
result of share market
Ah, No.. not right now. Thanks for reaching me out.
DeleteThank you for sharing a bunch of this quality contents, I have bookmarked your blog. Please also explore advice from my site. I will be back for more quality contents. best-laptop-for-medical-billing-and-coding
ReplyDeleteThanks for the blog loaded with so many information. Stopping by your blog helped me to get what I was looking for. Analisa Saham
ReplyDelete
ReplyDeletePersonal finances aren't about cashing your paycheck , paying your bills and meeting all of your monthly obligations. it's about having enough money saved so as to satisfy all of your financial goals in life.
finance
It seems is not working now for unknown reasons did you find any alternative way for the same
ReplyDeleteYes, you can also check "alpha_vantage" package for indian stocks. I will cover it in a blog post in near future.
Delete